How England’s 18,000 playgrounds revealed the country’s inequality
New research has analysed data from playgrounds across England. Here’s what they found
Outside of the home, public playgrounds are the most common places for children to play and the fundamental right of every child to play is even recognised in a UN convention. Despite this, there has been very limited research exploring inequality in the provision of playgrounds.
To help address this, we have analysed data from almost 34,000 playgrounds in England – the largest national dataset on playgrounds yet. In particular, we looked at England’s largest 534 settlements with populations over 15,000 and mapped patterns from the 18,077 children’s playgrounds within them.
We found substantial inequalities. For example, with two places broadly comparable in population size, one might have five times the number of children per playground.
With the exception of London, deprived settlements in England tend to have fewer, smaller and further-away playgrounds – a serious social justice issue. In London, however, relationships were found to be the opposite, with deprived areas tending to have more playgrounds in close proximity.
There are many different ways to measure the provision of playgrounds, but we used 21 indicators across three domains: the number of playgrounds per child, the size of playgrounds, and their closeness to where children live.
This ensured our results were not heavily influenced by a single variable, since some settlements excelled in one domain but were lacking in others.
Winners and losers
The graph below shows children’s playground provision for major settlements in England:
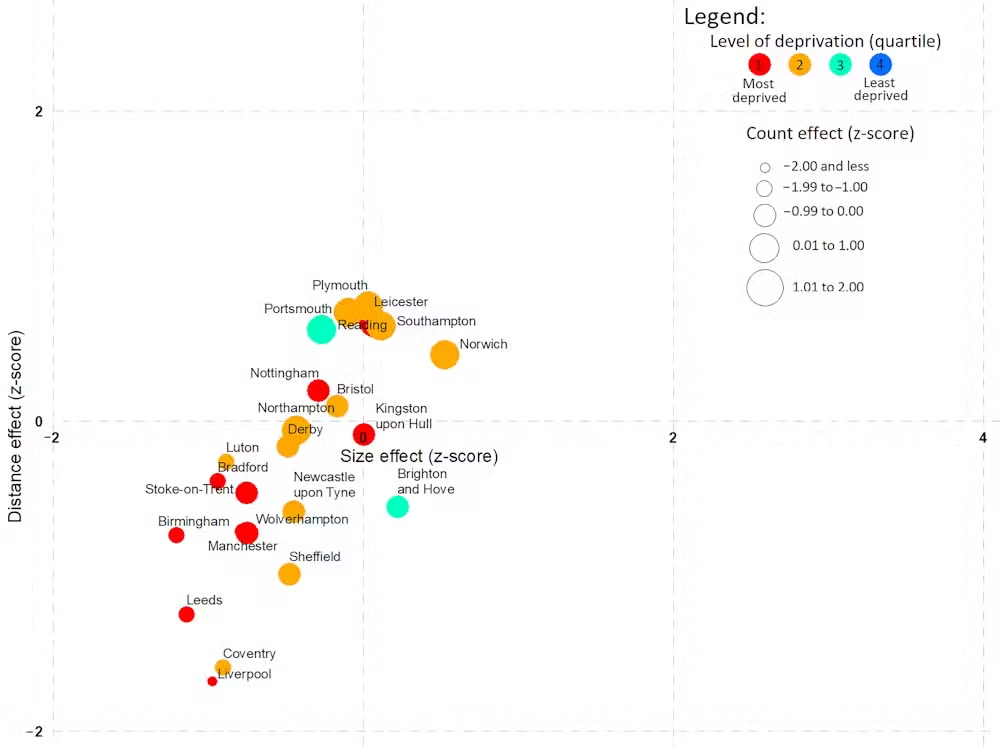
Places on the left of the graph have smaller playgrounds, while in places towards the bottom of the graph, kids have to travel further to a playground. Circle size indicates how many playgrounds there are per child.
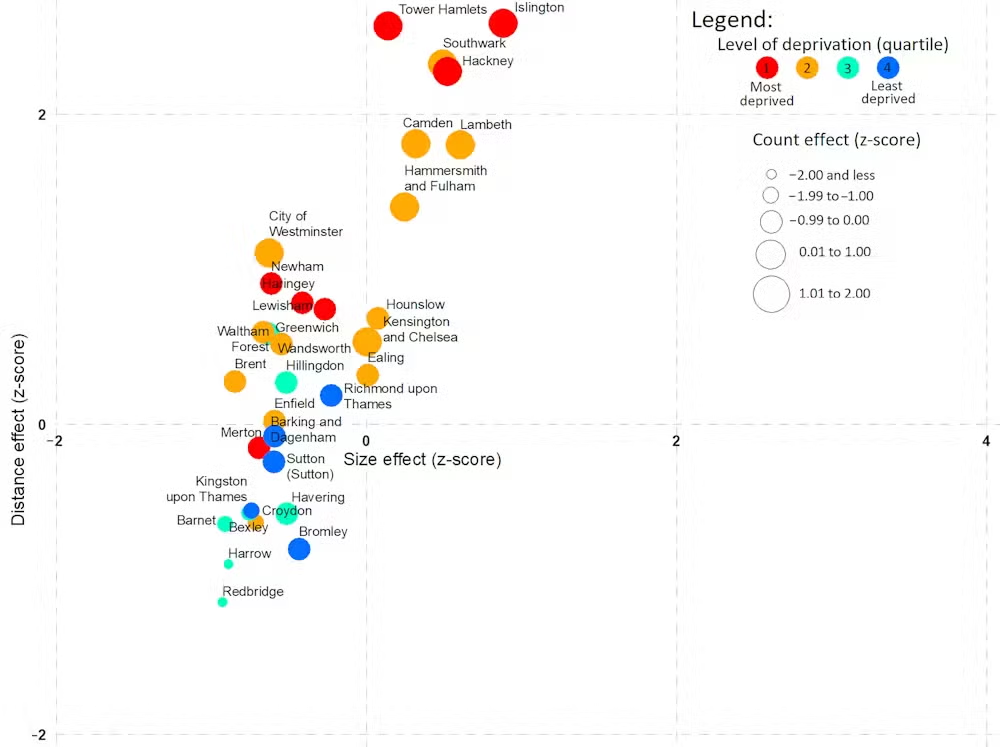
Here’s the same graph for the boroughs of London, where the relationship is reversed:
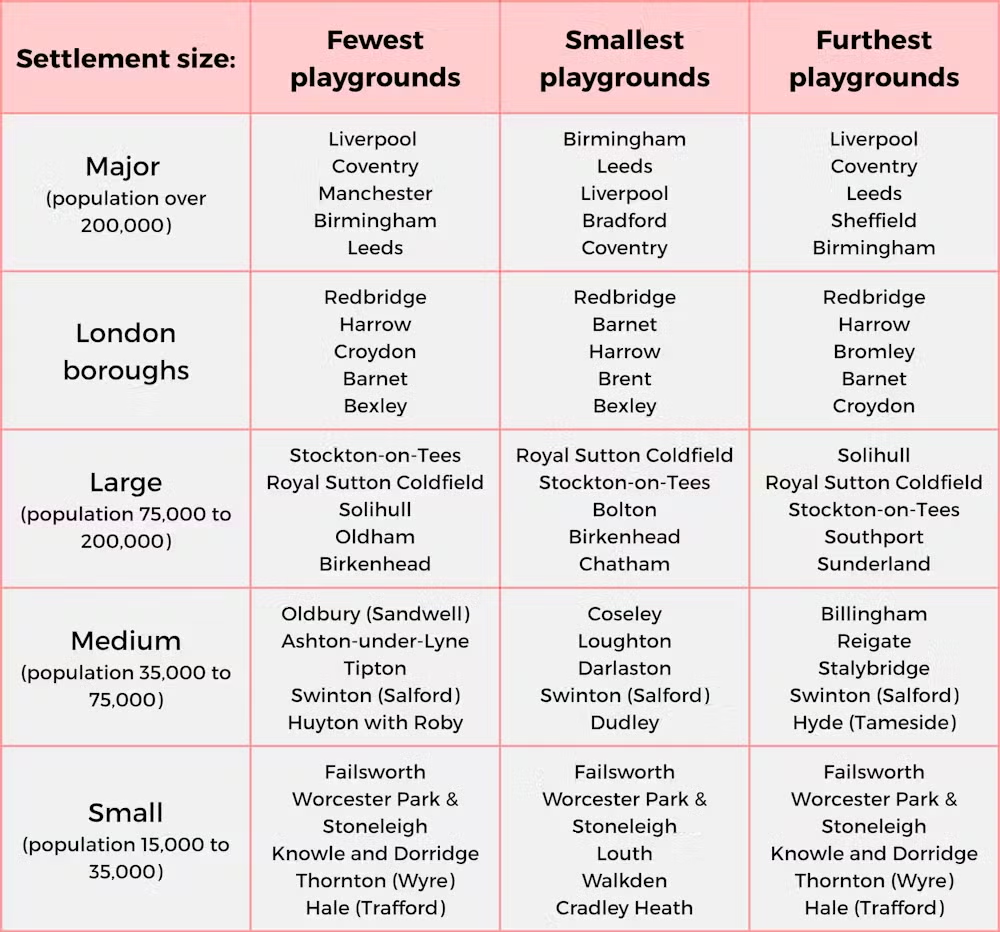
These are the top settlements in each category:
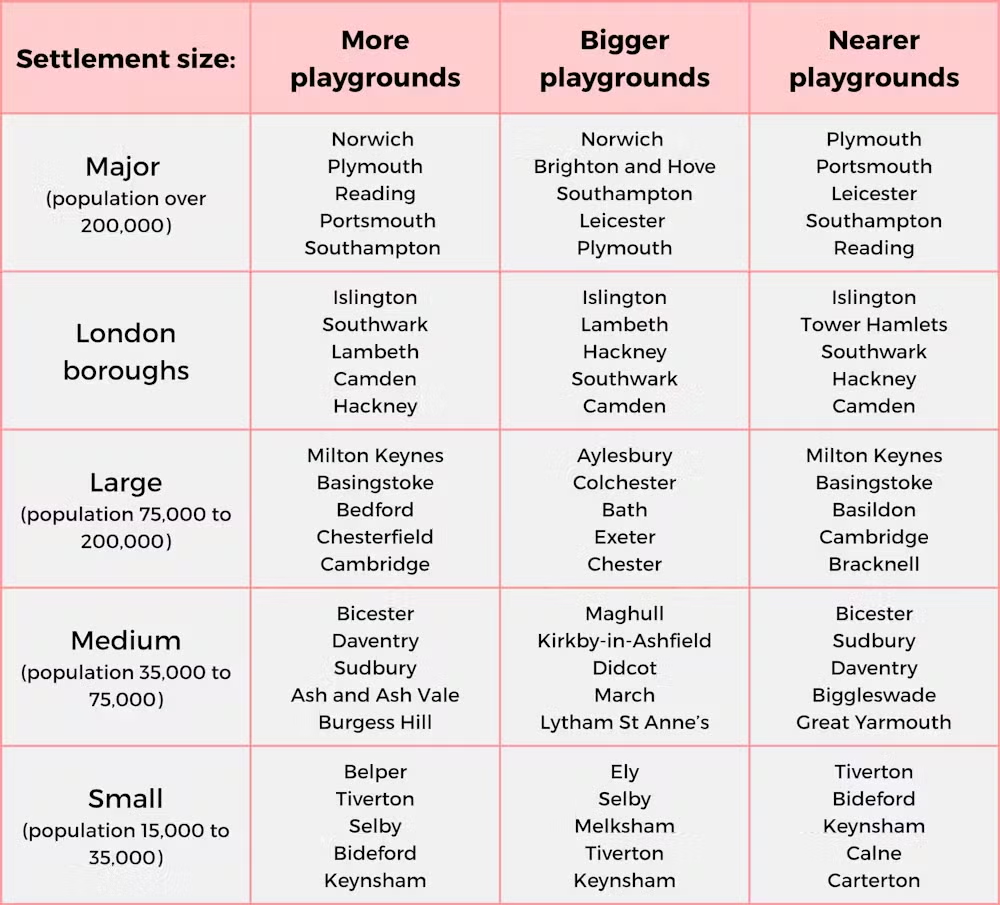
And these are the bottom:
Comparing major settlements, Liverpool has nearly five times more children under 16 per playground than Norwich (1,104 compared to 236). In London, the difference is even greater: the borough of Redbridge has nearly eight times more children per playground than Islington (1,567 v 204).
In terms of playground size, Leicester dedicates four times more of its urban area to playgrounds than Leeds (0.30% v 0.07%), while Norwich offers seven times more playground space per child than Birmingham (4.2 metres to 0.7 metres).
In London, Islington has five times the playground area of Barnet (0.64% of total urban area v 0.13%), and three times more space per child than Redbridge (2.8 metres v 0.9 metres).
Liverpool has the lowest percentage of children within 100, 300 and 500 metres of playgrounds, with Coventry having the lowest percentage at 800 metres.
In contrast, Southampton, Plymouth and Reading have the highest percentages of children living close to playgrounds.
In London, Redbridge and Kingston upon Thames had the lowest percentages of children living close to a playground, while Islington, Tower Hamlets and Hackney had the highest levels of provision. These distance measures will be heavily influenced by population density, especially in London (Redbridge is suburban; Islington is inner city). However, patterns outside of London appear more complex.
Different solutions for different places
Places like Norwich, Islington and Milton Keynes fared well across all three domains, while places like Liverpool, Leeds or Stockton-on-Tees did comparably poorly in all three. But most areas fell somewhere in between.
For example, places such as Portsmouth or Nottingham have good scores for distance but have poor provision in terms of size. They would, therefore, benefit most from expanding existing playgrounds.
In contrast, playgrounds in Brighton and Lincoln are bigger but tend to be further away. Places like these would benefit from a few new strategically positioned playgrounds to fill in the gaps.
As with any dataset, there are constraints. In future, we want to incorporate additional data on accessibility for disabled children, and we recognise that playgrounds are just one element across the wider spectrum of places where children play. For instance, children in outer London boroughs with few playgrounds might live nearer to woods or sports fields.
We also acknowledge that we have no data to monitor the quality of playgrounds. Is a 100 square metre playground filled with interesting and safe features? Or a single worn-out slide surrounded by fencing? Ultimately, playground use rather than provision is the most important measure. After all, a bad playground will not make children more active.
Following the launch of the first all-party parliamentary group on play in May 2025, our work is helping campaigners lobby for a “play sufficiency duty” in England (similar to Scotland and Wales) and a new national play strategy.
Our hope is that, as people become more aware of the problem, we’ll see new policies and better placemaking for children. Already, we are working with Play England (England’s national charity for play) on a “digital dashboard” capable of supporting councils to plan more strategically for play in their local areas.
Paul Brindley is a Senior Lecturer in the Department of Landscape Architecture at the University of Sheffield. Michael Martin is a Lecturer in Urban Design and Planning at the University of Sheffield.
This article is republished from The Conversation under a Creative Commons license. Read the original article.
Join our commenting forum
Join thought-provoking conversations, follow other Independent readers and see their replies
Comments